


Your agency/firm might be busy, but is it profitable?
Stop throwing darts in the dark when it comes to pricing your projects.
We’ve seen too many talented businesses and service providers burn through cash because they underestimate costs and overestimate their margins. The result? Working harder for less money while wondering where the profit went.
Project profitability isn’t magic. It’s math.
And once you understand the formulas, you’ll never again wonder if a project will make money before you even start.
Why Most Professional Services Firms Get Pricing Wrong
You’re not alone if you’ve ever finished a project wondering where your profit disappeared.
Most firms price projects using one of these flawed methods:
- Competitor-based pricing (copying what others charge)
- Cost-plus pricing (adding a random markup)
- Value-based pricing (without knowing your actual costs)
- Pure guesswork (hoping for the best)
The problem? None of these methods accounts for your real costs or desired profit margins.
When you don’t know your numbers, you can’t control your outcomes.
Your projects become expensive experiments instead of profitable investments.
The Real Cost of Poor Project Profitability
Poor pricing doesn’t just hurt one project. It creates a domino effect that can destroy your business.
Forgive me if this sounds familiar, but here’s what happens when you consistently underprice:
- You work longer hours for less money
- Quality suffers because you rush to stay profitable
- Team morale drops as workloads increase
- Cash flow becomes unpredictable
- Growth stagnates because there’s no profit to reinvest
Maintaining client/project profitability is one of the top concerns for firms (just behind business development), and for good reason. For example, research indicates that 51% of agencies employ project-based pricing models, making accurate project profitability calculations crucial for their survival.
Busy doesn’t equal successful.
The Foundation: Understanding Project Profitability Metrics
Before you can price profitably, you need to understand the key metrics that determine project success.
Gross Profit (Margin)
Your gross profit margin shows how much money remains after direct project costs. We work with many businesses that use gross margin as a key performance indicator (KPI) for all their key performance indicators (KPIs), and this very much depends on the level of direct costs and pass-through costs being handled by the business. For example, a consultancy or CPA firm will not have significant direct costs, so they will use revenue/billings for KPIs whereas Gross Profit will be more important for a business that has significant direct costs.
Formulas:
Gross Profit = Revenue – Direct Costs
Gross Profit Margin = (Revenue – Direct Costs) ÷ Revenue × 100
Direct costs include:
- Team member salaries for chargeable employees paid hourly rates
- Contractor payments
- Software and tool subscriptions
- Travel and meal expenses
- Third-party services
We have seen some businesses include all chargeable employee salaries as part of direct costs. That’s fine as long as the business is consistent in measuring this, but we prefer to exclude this for 2 reasons:
- Salaries are typically fixed irrespective of the number of hours worked
- Not all hours worked are chargeable. In fact, as you all know, employee chargeability varies between 20% to 90% depending on the role and seniority of the employee. See breakdown below.
Net Profit (Margin)
Net profit margin accounts for all business costs, including overhead. These are things like rent, rates, marketing, utilities, etc.
Formulas:
Net Profit = Revenue – All Cost
Net Profit Margin = (Revenue – All Costs) ÷ Revenue × 100
Industry net profit margin benchmarks vary from industry to industry. We did some research for one of our YouTube videos, “The Value of a PM,” and this showed the following:
Professional Services Sector | Average Profit Margin (Net) |
Consulting Services | 25% – 30% |
Legal Services | 20% – 50% |
Accounting Services | 10% – 40% |
Architecture and Engineering Services | 2% – 25% |
Information Technology (IT) Services | 3% – 30% |
Marketing and Advertising Services | 1% – 25% |
Financial Services | 10% – 30% |
These numbers come from large businesses that are required to report them. Our experience shows the following:
- Small businesses (under 10 employees): 15% average net margin
- Larger firms (25+ employees): 13% average net margin
- Marketing agencies typically achieve 6-12% net profit margins
10% net margin is ok, 20% is excellent
Delivery Margin
Once you’ve calculated gross and net profit, the next step is evaluating how your project margins compare to industry expectations. This is where delivery margin comes in.
Delivery margin (also known as contribution margin or net project margin) measures the amount of profit remaining after covering all direct and allocated overhead costs. It’s a critical indicator of whether your pricing and delivery practices are sustainable. By setting clear delivery margin targets, your firm can ensure that projects not only cover their costs but also contribute to long-term profitability. Hitting these targets consistently means you’re pricing correctly, managing resources effectively, and running a healthy business.
Your delivery margin should hit these targets:
- 55-60% across all projects for healthy businesses
- 60-75% per individual project to account for variability
- Above 55% indicates efficient pricing and cost management
These targets ensure you cover overhead costs and generate meaningful profit.
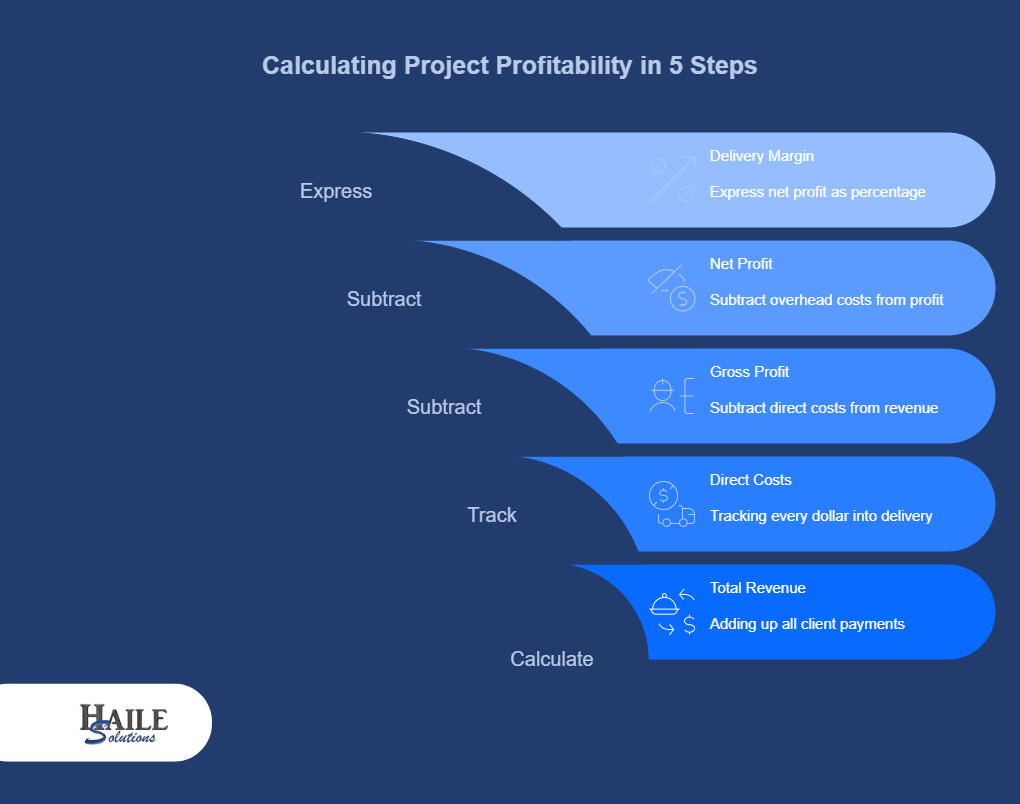
The 5-Step Method for Calculating Project Profitability
Understanding project profitability can be complex; we provide more detail below. That said, we’ve done all the heavy lifting for you and created a billing rate calculator. You can download it on the link below.
Download the Free Billing Rate Calculator
In the meantime, the “quick and dirty” way to calculate this is as follows:
Step 1: Calculate Total Revenue
Add up all the payments you’ll receive from the client.
Include:
- Base project fees
- Additional services
- Milestone payments
- Expense reimbursements
Step 2: Identify Direct Costs
Track every dollar that goes directly into project delivery.
Labor Costs:
- Billable team hourly rates
- Contractor and freelancer payments
- Benefits, payroll taxes, and social security (if applicable)
Project Expenses:
- Software licenses
- Stock photos and assets
- Travel and accommodation
Supplier Bills:
- Third-party services
- Subcontractor work
- Specialized tools
Step 3: Calculate Gross Profit
Subtract direct costs from total revenue.
This number tells you how much money contributes to covering overhead and generating profit.
If your gross profit is negative, you’re losing money on direct costs alone. That is very bad!
Step 4: Determine Net Project Profit
Subtract your allocated overhead costs from gross profit.
Overhead allocation should include:
- Office rent and utilities
- Administrative salaries
- Insurance and legal fees
- Marketing and sales costs
- General software subscriptions
Step 5: Calculate Your Delivery Margin
Express your net project profit as a percentage of total revenue.
This final number determines if your project meets profitability targets.
Advanced Metrics That Separate Profitable Agencies
Once you master basic profitability calculations, these advanced metrics help optimize your pricing strategy.
Rate of Realization
This metric compares your expected profit to actual profit.
Formula: Actual Profit ÷ Expected Profit × 100
A rate below 90% indicates scope creep, inefficient processes, or inaccurate estimates.
Utilization Rate
We already touched on this above. Track how much of your team’s available time generates billable revenue.
Formula: Billable Hours ÷ Total Available Hours × 100
Target utilization rates:
- Partners/Principals 15% – 30%
- Senior team members: 75-85%
- Junior team members: 85-95%
- Specialists: 70-80%
Remember that total available hours must account for vacation days, sick leave, public holidays, training time, and administrative work.
Resource Profitability
Calculate profit generated per team member or resource.
Formula: Revenue Generated – Resource Cost
This helps you identify your most profitable team members and optimize resource allocation.
Time Tracking: The Secret Weapon for Accurate Pricing
Accurate time tracking transforms guesswork into data-driven pricing decisions.
Here’s why time tracking matters:
- Reveals actual project costs vs estimates
- Identifies scope creep before it kills profits
- Improves future project estimates
- Optimizes team productivity
- Provides data for client negotiations
Without accurate time tracking, you’re flying blind.
Track time at the task level, not just the project level. This granular data helps you identify which activities consume the most resources and where you can improve efficiency.
Tools and Systems for Project Profitability Management
Manual profitability calculations waste time and introduce errors.
The right tools automate calculations and provide real-time insights.
Essential Features to Look For:
- Automated time tracking
- Real-time profit calculations
- Budget vs actual reporting
- Resource utilization tracking
- Integration with accounting software
- Custom profitability dashboards
Popular Options Include:
- Productive.io for comprehensive project management
- Scoro for automated profitability tracking
- Deltek WorkBook for creative agency workflows
Choose tools that integrate with your existing systems and provide the specific metrics your agency needs.
The investment in proper tools pays for itself through improved project margins and reduced administrative overhead.
Ready to calculate your minimum billing rates? Download our free Billing Rate Calculator to determine the exact rates you need to charge based on your costs and desired profit margins.
Download the Free Billing Rate Calculator
Common Pricing Mistakes That Kill Profits
Learn from these costly mistakes we see agencies make repeatedly.
Mistake 1: Underestimating Scope Creep
Always include a buffer for scope changes. Even small additions can destroy project profitability.
Build change order processes into your contracts and communicate costs upfront.
Mistake 2: Forgetting Overhead Allocation
Your project prices must cover more than direct costs. Include your fair share of rent, utilities, administrative costs, and all employer expenses.
The Billing Rate Calculator helps you properly allocate total business costs across all billable hours to ensure nothing is missed.
Many firms fail because they price only for direct costs and forget about overhead.
Mistake 3: Competing on Price Alone
Low prices attract low-value clients who demand more work for less money.
Focus on value and results instead of being the cheapest option.
Mistake 4: Not Tracking Actual vs Estimated Time
Without this data, you can’t improve your estimates or identify problem areas.
Review time tracking data after each project to refine your estimation process.
Mistake 5: Ignoring Opportunity Cost
Every hour spent on a low-profit project is an hour you can’t spend on high-profit work.
Factor opportunity cost into your pricing decisions.
Building Profitable Pricing Into Your Process
Create systems that ensure every project starts with profitability in mind.
Before You Quote:
- Calculate your minimum acceptable profit margin
- Research client budget and expectations
- Estimate time requirements based on historical data
- Include contingency for scope changes
- Factor in team availability and skill levels
During Project Delivery:
- Track time and expenses in real-time
- Monitor progress against budget
- Identify scope creep immediately
- Communicate cost implications to clients
- Adjust resource allocation as needed
After Project Completion:
- Analyze actual vs estimated costs
- Calculate final profit margins
- Document lessons learned
- Update estimation processes
- Use data to improve future quotes
The Psychology of Profitable Pricing
Pricing isn’t just about numbers. It’s about positioning your value and managing client expectations.
Price with Confidence
Your pricing reflects your perceived value. Low prices signal low quality to many clients.
Price based on the results you deliver, not just the time you spend.
Communicate Value Clearly
We can’t overstate this point!
Help clients understand what they’re paying for and why it costs what it does.
Break down pricing into components so clients see the value in each element.
Set Boundaries Early
Define scope clearly and communicate the cost of changes upfront.
This prevents scope creep and protects your profit margins.
Creating Your Pricing Strategy
Develop a systematic approach to pricing that ensures consistent profitability.
Determine Your Profit Goals
Set specific profit margin targets for different types of projects:
- Strategic consulting: 40-60% margins
- Creative projects: 30-50% margins
- Implementation work: 20-40% margins
Build Your Rate Structure
Establish hourly rates for different skill levels and project types.
Factor in:
- Market rates for similar services
- Your team’s experience and expertise
- The value you deliver to clients
- Your target profit margins
- All employer costs (taxes, benefits, social security)
- Non-billable time (training, admin, marketing)
- Total business overhead allocation
Need help calculating your minimum billing rates? Our Billing Rate Calculator does the math for you, factoring in all your costs and desired markup to determine profitable rates for each role.
Get Your Free Billing Rate Calculator
Test and Refine
Monitor project profitability consistently and adjust your pricing strategy based on results.
Track which types of projects and clients generate the highest margins.
Measuring Success
Track these key metrics to ensure your pricing strategy delivers results:
Project-Level Metrics:
- Gross profit margin per project
- Net profit margin per project
- Actual vs estimated hours
- Client satisfaction scores
Business-Level Metrics:
- Overall profit margins
- Revenue per employee
- Client lifetime value
- Project success rates
Review these metrics monthly and adjust your pricing strategy as needed.
Next Steps: Implementing Profitable Pricing
Start with these immediate actions:
- Audit Your Current Projects Calculate actual profit margins for your last 10 projects and compare them to your target markup
- Implement Time Tracking Start tracking time at the task level immediately, including billable vs non-billable hours
- Calculate Your True Costs Use our Billing Rate Calculator to determine minimum rates based on your total costs and desired markup
- Set Profit Targets Define minimum acceptable margins for different project types
- Create Pricing Templates Build standardized pricing models for common project types
- Train Your Team Ensure everyone understands the importance of project profitability and accurate time tracking
Remember: Profitable pricing isn’t about charging more. It’s about understanding your true costs and pricing accordingly.
When you price with data instead of guesswork, you transform your agency from a chaotic hustle into a profitable, scalable business.
Your projects become investments that pay dividends instead of expensive experiments that drain your resources.
Start measuring. Start tracking. Start profiting.
FAQ: Project Profitability and Pricing
Project profitability is the amount of money remaining after all project costs are subtracted from project revenue. It matters because without profitable projects, your agency cannot grow, reinvest in your team, or weather economic downturns. Many agencies focus on revenue growth while ignoring profitability, leading to unsustainable business models.
Download and use our Billing Rate Calculator
If you want something simple, use this 5-step process: (1) Calculate total revenue including all client payments, (2) Identify direct costs including labor, expenses, and supplier bills, (3) Calculate gross profit by subtracting direct costs from revenue, (4) Determine net profit by subtracting allocated overhead costs, (5) Calculate delivery margin as net profit divided by total revenue. This gives you a clear picture of each project’s financial contribution.
Industry benchmarks suggest targeting 60-70% delivery margins per project and 50%+ overall. For net profit margins, aim for 10% minimum (acceptable), 15% average for small businesses, and 20% for excellent performance. Strategic consulting typically achieves margins of 40-60%, creative projects 30-50%, and implementation work 20-40%.
Accurate time tracking reveals the difference between estimated and actual project costs, helps identify scope creep before it damages profitability, improves future project estimates, and provides data for client negotiations. Most agencies underestimate time requirements by 20-30% without proper tracking. Track time at the task level for maximum insight.
The five biggest mistakes are: (1) Underestimating scope creep without building in buffers – research shows agencies typically need 15-20% contingency funds, (2) Forgetting to allocate overhead costs in project pricing, (3) Competing on price alone rather than value, (4) Not tracking actual vs estimated time to improve estimates, and (5) Ignoring opportunity cost when accepting low-profit projects that prevent you from pursuing higher-margin work.
Haile Solutions specializes in helping professional services firms implement proper financial systems and ERP solutions that provide real-time project profitability tracking. We offer vendor-neutral ERP selection, fractional CFO services for financial clarity, and process optimization to eliminate profit leaks. Our bilingual support and cultural competency make us uniquely positioned to serve diverse professional services firms seeking sustainable growth through better financial management.
Look for tools with automated time tracking, real-time profit calculations, budget vs actual reporting, resource utilization tracking, accounting software integration, and custom profitability dashboards. Popular options include Productive.io for comprehensive project management, Scoro for automated profitability tracking, and Deltek WorkBook for creative agency workflows. Choose tools that integrate with your existing systems and provide the specific metrics your firm needs.
Start by researching market rates for similar services, calculating your true hourly costs including overhead, setting minimum profit margin targets, building in contingencies for unknowns, and using industry benchmarks as guides. Document everything from your first properly-priced projects to build your own historical database. Consider partnering with a fractional CFO who can help establish proper pricing frameworks from the beginning.